

American Airlines Group Inc. stocks have been trading down by -3.42 percent amid mounting concerns over slowing travel demand.
Key Takeaways For AAL Traders
- Wall Street has lined up with lower targets on AAL as higher jet fuel costs squeeze margins even while travel demand stays solid.
- Management at American Airlines says Q4 fuel could run about $1B higher than planned, and warns further capacity cuts are on the table.
- Multiple banks — including BMO, Bank of America, and Goldman Sachs — cut their AAL price targets, with Goldman sticking to a Sell call.
- Morgan Stanley now expects deeper losses for American Airlines, arguing fuel prices near double prior assumptions threaten long‑term cost goals.
- Sector sentiment weighs on AAL as Delta’s weak earnings and guidance have pulled major U.S. airline stocks lower in sympathy.
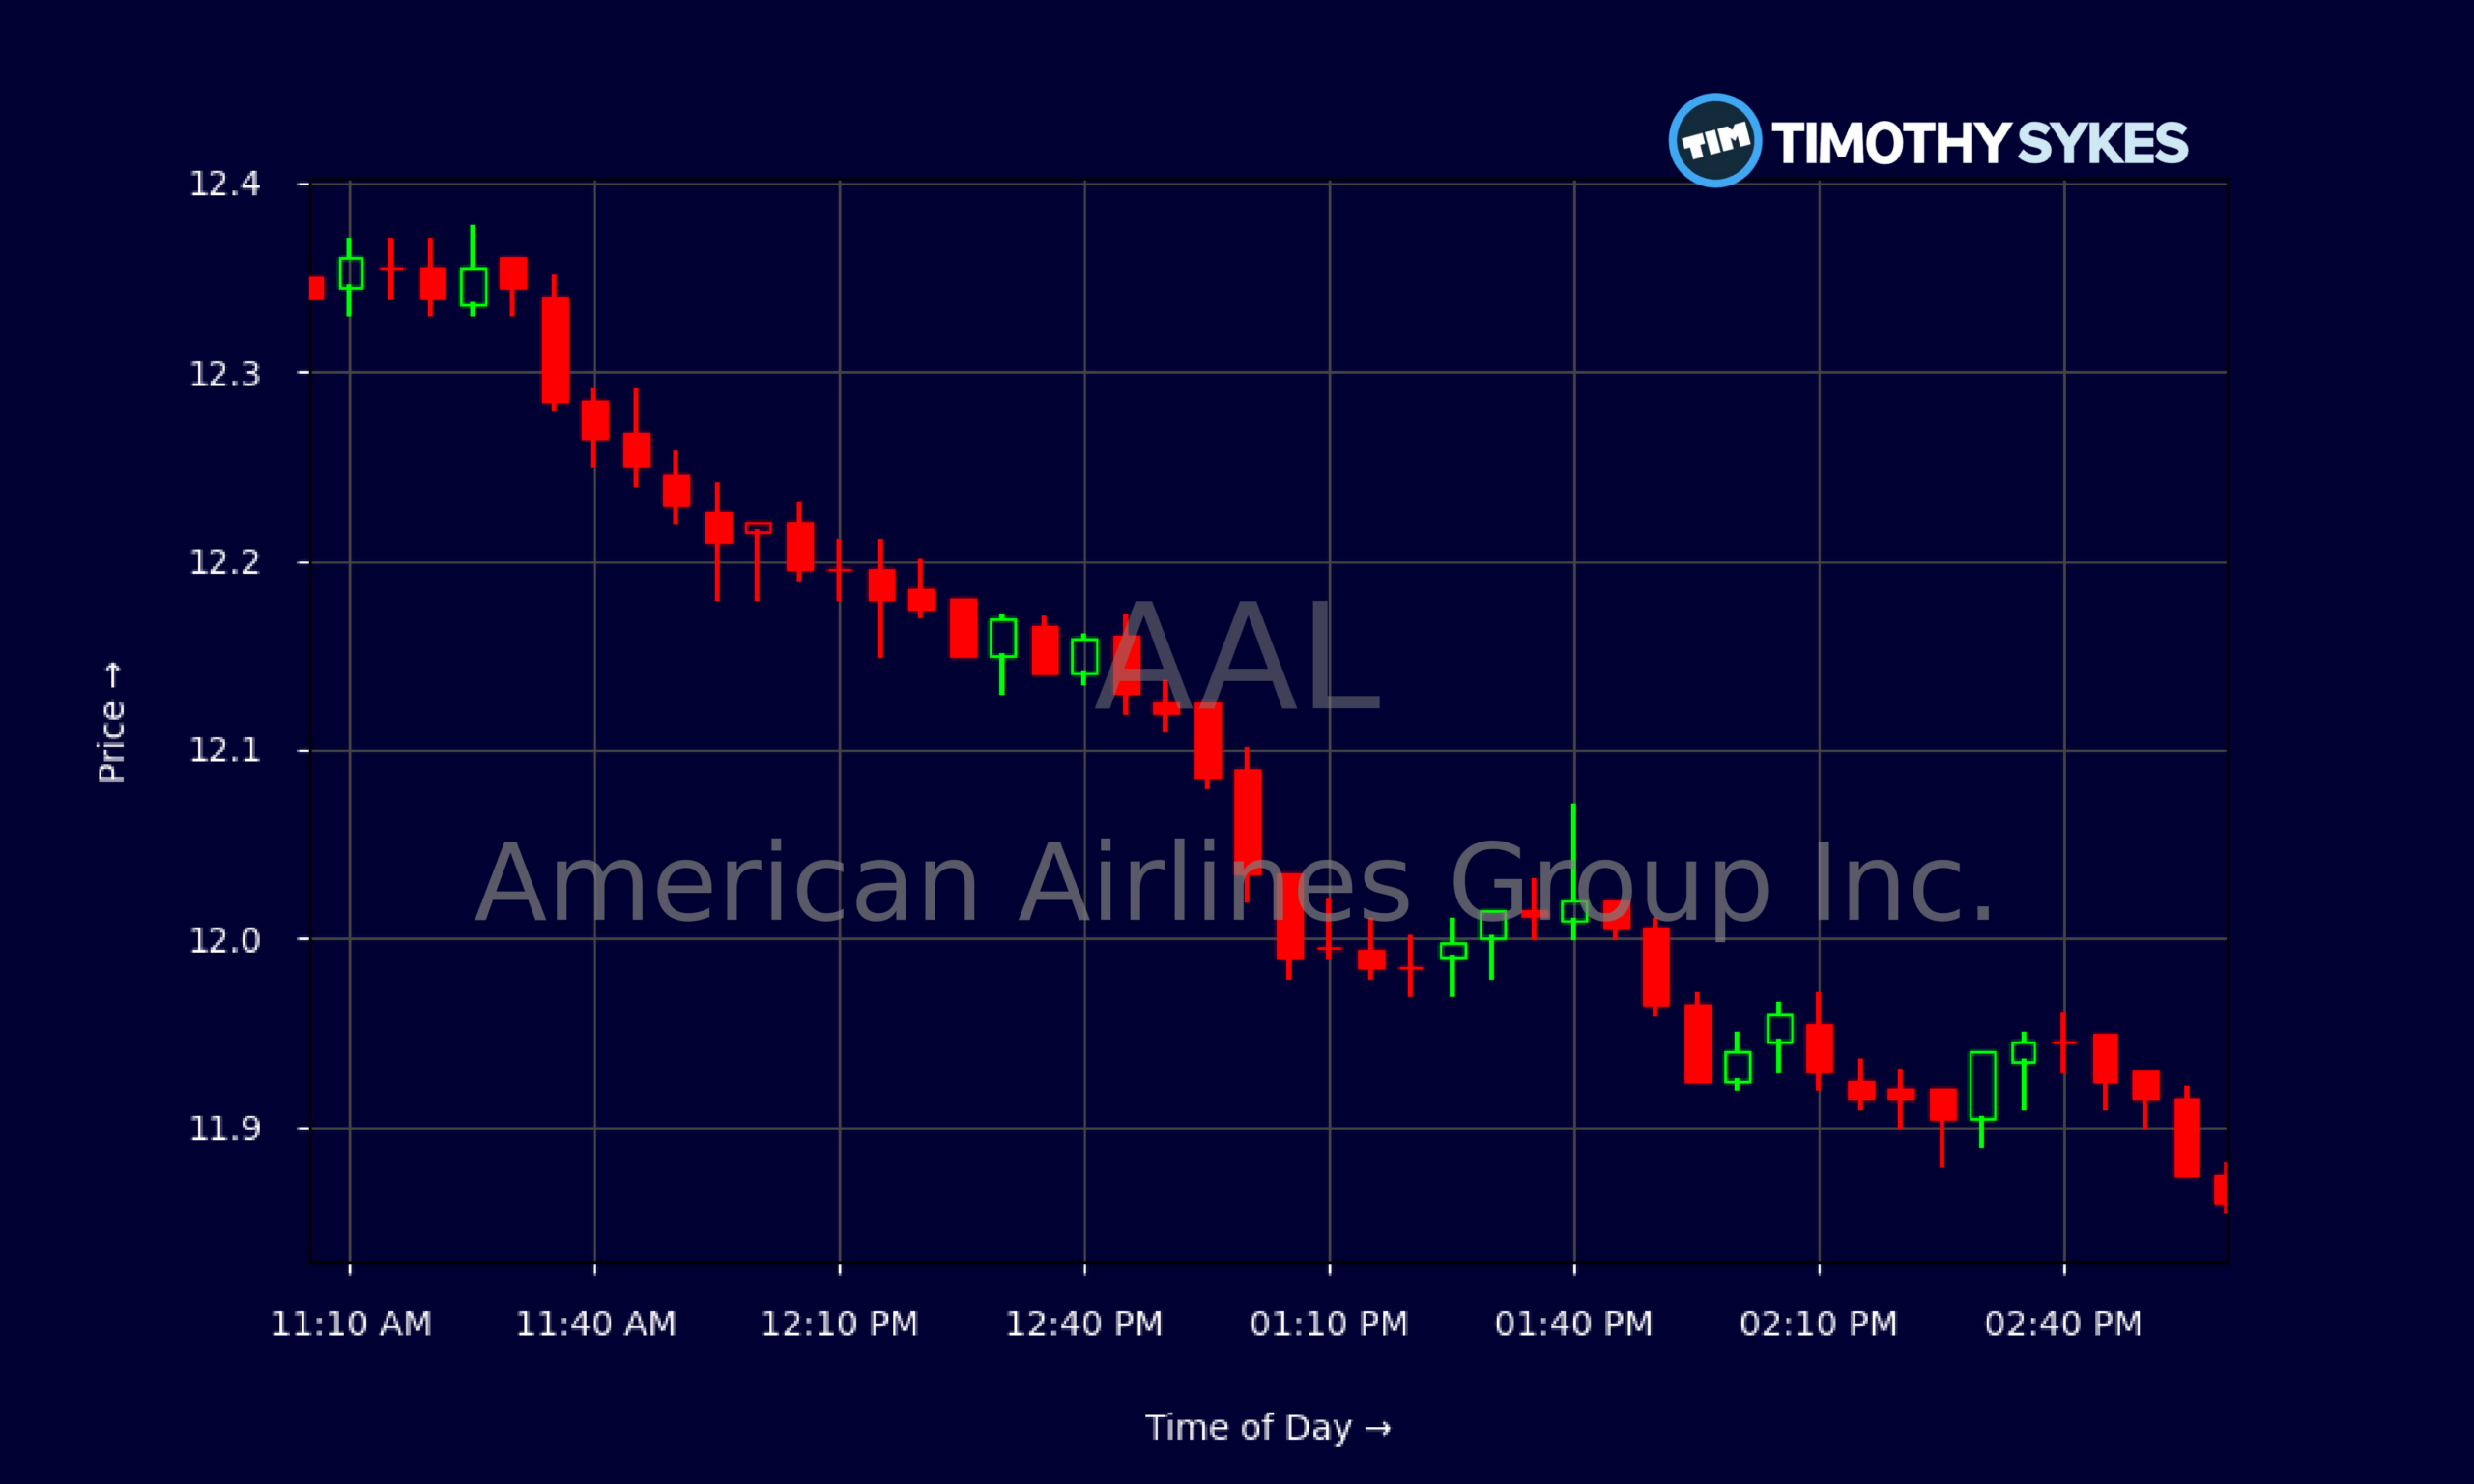
Live Update At 15:02:27 EDT: On Friday, October 16, 2026 American Airlines Group Inc. stock [NASDAQ: AAL] is trending down by -3.42%! Discover the key drivers behind this movement as well as our expert analysis in the detailed breakdown below.
Quick Financial Overview
AAL traders are dealing with a stock that is sliding while the business grinds out thin profits. Over the last few weeks, American Airlines shares have drifted down from the mid‑$13s to around $11.86, a clear downtrend on the daily chart. Each bounce toward $13 has been sold, showing sellers remain in control.
Intraday, AAL has traded in a tight band, mostly between $11.85 and $12.35. That narrow range tells traders the stock is coiling, not trending intraday, which usually favors short‑term scalps over big swing bets. Volume and range compression often come before a larger move.
Fundamentally, American Airlines just printed quarterly revenue of about $16.7B with only $71M in net income. That is a razor‑thin profit on huge sales. Operating income of $453M shrinks fast once you subtract $409M of interest expense, a reminder that AAL’s heavy debt load matters.
More Breaking News
Key ratios back that up. The current ratio of 0.5 and quick ratio of 0.4 show limited short‑term cushion, while an interest coverage of just 2.1 keeps pressure on cash flow. For active traders, that mix of high leverage, low margins, and a weak chart keeps AAL firmly in “trade the volatility, not the story” territory.
Why Traders Are Watching AAL Now
American Airlines is in the middle of a full Wall Street reset, and that is exactly when serious traders pay attention. The core problem is simple: fuel. Management has warned that persistently high fuel prices may add roughly $1B to Q4 costs, and AAL is already talking about more capacity cuts to cope. When an airline starts trimming schedules, it is signaling that protecting margins is more important than chasing growth.
That warning is driving the analyst downgrades. BMO Capital cut its AAL price target from $19 to $15.50, while keeping a Market Perform rating. In plain English, BMO sees American Airlines as fairly valued with balanced upside and downside — not a disaster, but not a clear bargain either, given fuel tied to Middle East tensions.
Bank of America followed, cutting its target from $17 to $15 and staying Neutral on AAL ahead of Q3 earnings. Then Goldman Sachs took the knife deeper, slashing its target from $13 to $11 and reiterating a Sell rating. That is the loudest bearish call on the stock right now and gives traders a clean sentiment marker: one big desk expects underperformance from here.
Morgan Stanley adds a longer‑term layer to the story. The firm says jet fuel prices have roughly doubled from what airlines like American Airlines had modeled, and now forecasts deeper losses for AAL and JetBlue. Its warning that elevated energy costs threaten 2027 capacity and ex‑fuel unit cost targets tells traders this is not just a one‑quarter hiccup.
At the same time, sector read‑throughs are hurting the tape. Delta’s earnings miss and guidance cut on fuel sent Delta down and pulled American Airlines, United, Southwest, and others lower in sympathy. For AAL traders, that correlation matters — bad news at one carrier is being treated as bad news for the group.
Conclusion
For active traders, AAL is a classic pressure‑cooker setup: heavy debt, thin margins, and now a fuel shock that is forcing American Airlines to rethink its entire capacity plan. The company’s own CEO has flagged the need for possible further Q4 capacity cuts. That means AAL is trying to balance fewer seats against stronger pricing, all while absorbing about $1B in extra fuel costs.
On the chart, that stress shows up as a steady grind from the $13s down toward the high $11s. The recent 1% pre‑market drops tied to Delta’s weak update confirm that American Airlines is trading as part of a fragile sector basket. When one major carrier stumbles on fuel, others, including AAL, get hit first and ask questions later.
Longer term, the Morgan Stanley view should stay on every trader’s radar. If fuel remains elevated into 2027, American Airlines’ cost targets and capacity ambitions look stretched. Combine that with Goldman’s Sell call and lower targets from BMO and Bank of America, and you get a market that is clearly skeptical.
For the Tim Sykes‑style crowd, this is where discipline matters. As Tim Sykes likes to say, “The market doesn’t care about your opinion, only your preparation and your risk management.” As millionaire penny stock trader and teacher Tim Sykes says, “Embrace the journey, the ups and downs; each mistake is a lesson to improve your strategy.”. With AAL, that means respecting the downtrend, watching how the stock reacts to every new fuel and capacity headline, and treating each bounce or flush as a trading opportunity — not a guarantee. This article is for educational and research purposes only and is not investment advice.
This is stock news, not investment advice. Timothy Sykes News delivers real-time stock market news focused on key catalysts driving short-term price movements. Our content is tailored for active traders and investors seeking to capitalize on rapid price fluctuations, particularly in volatile sectors like penny stocks. Readers come to us for detailed coverage on earnings reports, mergers, FDA approvals, new contracts, and unusual trading volumes that can trigger significant short-term price action. Some users utilize our news to explain sudden stock movements, while others rely on it for diligent research into potential investment opportunities.
Dive deeper into the world of trading with Timothy Sykes, renowned for his expertise in penny stocks. Explore his top picks and discover the strategies that have propelled him to success with these articles:
- Penny Stocks Trading Guide
- Best Penny Stocks Under $1 to Buy Today
- Top 8 Penny Stocks to Watch on Robinhood
Once you’ve got some stocks on watch, elevate your trading game with StocksToTrade the ultimate platform for traders. With specialized tools for swing and day trading, StocksToTrade will guide you through the market’s twists and turns.
Dig into StocksToTrade’s watchlists here:





Leave a reply