

EOG Resources Inc. stocks have been trading up by 4.23 percent after upbeat shale production outlook boosted investor optimism.
What Traders Need To Know
- Jefferies raised its price target on EOG Resources to $185 and sees Q3 cash flow per share beating estimates by 13% on stronger production and lower costs into 2027.
- UBS nudged its target to $186 while keeping a Buy rating, reinforcing strong institutional conviction in EOG Resources Inc.
- Mizuho lifted its target to $165 and kept an Outperform rating, adding to a cluster of targets in the mid‑$160s.
- Multiple notes cite a consensus overweight stance with mean targets in the mid‑$160s, above the current share price in the low‑ to mid‑$150s.
- Scotiabank’s new Sector Perform at $144 sits below Street averages, reminding traders that not all see aggressive upside from here.
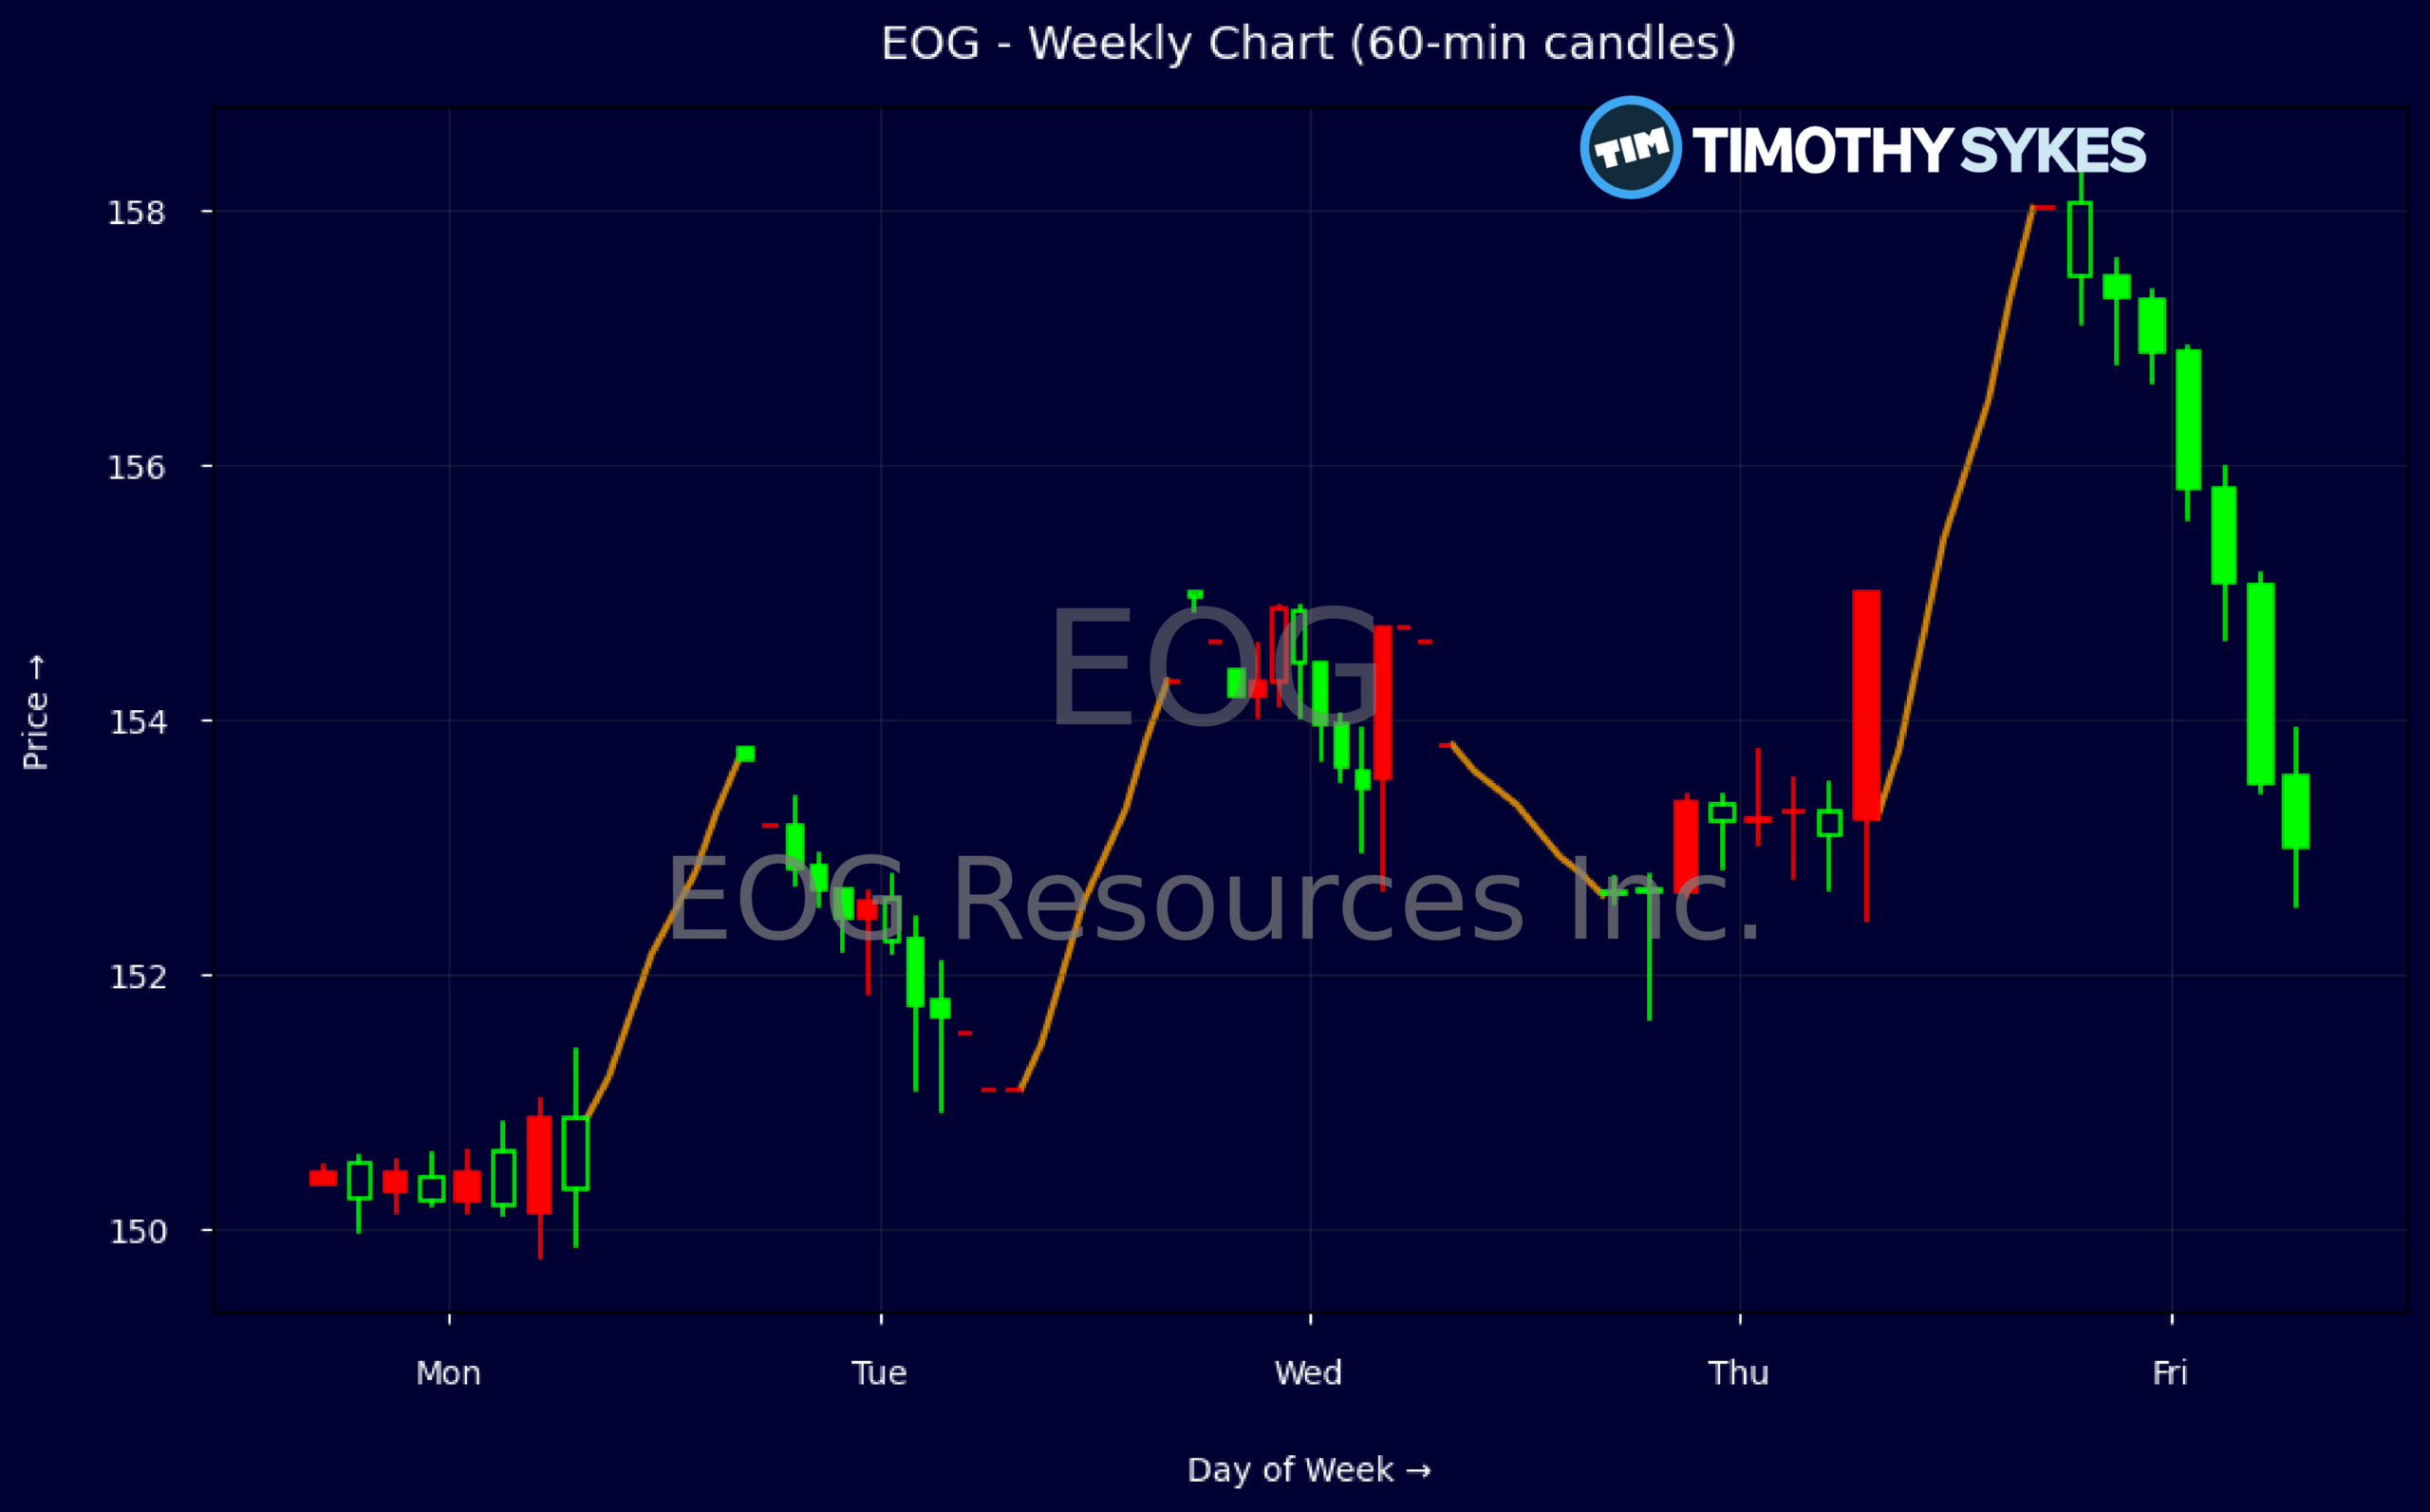
Weekly Update Oct 12 – Oct 16, 2026: On Friday, October 16, 2026 EOG Resources Inc. stock [NYSE: EOG] is trending up by 4.23%! Discover the key drivers behind this movement as well as our expert analysis in the detailed breakdown below.
Energy industry expert:
Analyst sentiment – positive
EOG sits in the top tier of North American E&Ps, combining scale with excellent capital efficiency. EBIT margin of 27% and EBITDA margin above 45% underscore advantaged rock and cost discipline, while ROE of ~23–25% and ROIC in the mid-teens are among the best in large-cap energy. The balance sheet is conservative (D/E 0.26, interest coverage >45x, current ratio 1.9), enabling shareholder returns: ~$4.1B FCF annualized versus only ~$1.1B dividends plus buybacks in the latest quarter. Valuation at ~11.5x earnings and ~4.2x cash flow is attractive versus quality and growth profile.
Technically, EOG is in a firm uptrend, with weekly closes stepping higher from ~$150 to $158 and no meaningful violation of prior lows. The sharp jump from $152–153 resistance to a $158 close confirms a breakout, supported by elevated intraday volume on up candles in the 5‑minute tape. Dominant trend is bullish; pullbacks toward the prior breakout zone at $153–154 should offer high‑probability entries, with $150 as a tight stop for active traders.
Fundamentally and versus Energy and Fossil Fuels benchmarks, EOG offers superior returns on capital, lower leverage, and competitive yield plus buybacks. Recent analyst activity is overwhelmingly constructive, with multiple target hikes clustering in the $160–186 range and Street mean around $165–166, all above the current ~$158 level. With oil near $100 and 2027 plans pending, I see continued multiple support. My 12–18 month fair value is $175, with near-term support at $153 and resistance at $165.
More Breaking News
Quick Financial Overview
EOG Resources Inc. is trading in the low‑ to mid‑$150s while consensus targets sit roughly one trading range higher, in the mid‑$160s to high‑$180s band. Recent weekly data show a steady climb from about $150 to $158, with higher closes through the week, signaling firm demand into strength. The intraday tape reinforces this: a tight range between $153 and $158, with closes holding near the top of the day, tells traders that dips are being bought rather than aggressively sold.
On the fundamental side, EOG Resources posts about $22.6B in annual revenue with a profit margin near 26% and an EBIT margin around 27%. Cash flow is a standout: roughly $4.67B in operating cash flow and $2.89B in free cash flow in the recent quarter, while capital spending ran near $1.63B. That cash supports both a roughly 2.7% dividend yield on a $4.08 dividend rate and sizeable buybacks, with over $1.29B of stock repurchased.
The balance sheet is another key edge for traders assessing downside risk. Debt levels are modest relative to equity, with total debt to equity around 0.26 and interest coverage above 45, showing ample capacity to ride out commodity swings. Returns on equity above 22% and returns on capital in the mid‑teens highlight efficient use of capital compared with many peers. Valuation around 11.5x earnings and under 7x free cash flow leaves room for multiple expansion if oil stays firm and EOG Resources keeps its cost discipline.
Conclusion
Recent trading action in EOG Resources Inc. reflects a market digesting a wave of upbeat analyst calls while pricing in strong fundamentals. The stock has pushed from roughly $150 to the high‑$150s, with intraday charts showing tight, controlled buying pressure rather than speculative spikes. For short‑term traders, that usually means any pullback toward prior support zones in the low‑$150s will be the real test of trend strength.
On the news front, Jefferies, UBS, Mizuho, BMO, and others all raised price targets, with several clustered around or above the mid‑$160s. That sets up a clear reference zone for upside scenarios if Q3 cash flow and 2027 plans match the bullish expectations. At the same time, Morgan Stanley’s Equal Weight view and Scotiabank’s Sector Perform at $144 remind traders that valuation is not a one‑way bet, especially after a solid run.
Given EOG Resources’ strong margins, heavy free cash flow, and conservative balance sheet, the risk‑reward skews constructive as long as oil holds firm and management sticks to disciplined capital spending. For traders, the key catalysts are the upcoming earnings print, detail on 2027 capital plans, and the market’s reaction around the current $150–$160 band. As I tell my students, “The edge is not in the headline – it’s in how the stock trades when that headline hits the tape.” And just as crucially, trade management matters as much as trade selection; as millionaire penny stock trader and teacher Tim Sykes, says, “It’s not about how much money you make; it’s about how much money you keep.”.
This is stock news, not investment advice. Timothy Sykes News delivers real-time stock market news focused on key catalysts driving short-term price movements. Our content is tailored for active traders and investors seeking to capitalize on rapid price fluctuations, particularly in volatile sectors like penny stocks. Readers come to us for detailed coverage on earnings reports, mergers, FDA approvals, new contracts, and unusual trading volumes that can trigger significant short-term price action. Some users utilize our news to explain sudden stock movements, while others rely on it for diligent research into potential investment opportunities.
Dive deeper into the world of trading with Timothy Sykes, renowned for his expertise in penny stocks. Explore his top picks and discover the strategies that have propelled him to success with these articles:
- Penny Stocks Trading Guide
- Best Penny Stocks Under $1 to Buy Today
- Top 8 Penny Stocks to Watch on Robinhood
Once you’ve got some stocks on watch, elevate your trading game with StocksToTrade the ultimate platform for traders. With specialized tools for swing and day trading, StocksToTrade will guide you through the market’s twists and turns.
Dig into StocksToTrade’s watchlists here:





Leave a reply